
Group 08 - Cleanroom Telemetry System
![[Vídeo do projeto]](/projects/group08/Electronics.jpg%20FFFFFFFFAZER)
| Team: |
Group 08: Victor Padeiro (Coord.) , Bernardo Cordeiro , José Santos , Rodrigo Caldelas , Sofia Fernandes |
| Company: | PICadvanced |
| Supervisors: |
Paulo Salvador (DETI)
Carla Rodrigues (PICadvanced) |
To guarantee the precision of PICadvanced's testing of optoelectronic transceivers, we developed a Cleanroom Telemetry System. This solution monitors critical environmental data, such as temperature, humidity, vibrations, and particles in real-time. Built on a robust architecture using Zigbee sensors, Docker, and the ELK Stack, it features automated email alerting and custom visualization dashboards, ensuring a strictly controlled environment for high-tech manufacturing.
- Challenge Proposed challenge, initial specifications, requirements, constraints, …
- Results
- More information - Architecture
Challenge Proposed challenge, initial specifications, requirements, constraints, …
The core objective of this project was to create a telemetry system for the PICadvanced Cleanroom to monitor environmental conditions critical to product quality. Initially, the team conceptualized a classic IoT architecture: a network of sensors that would transmit data to a central Raspberry Pi, which would then forward it to a server for visualization. The goal was to keep the data path simple and the interface user-friendly.
In addition to the project’s core objectives (measuring environmental parameters and displaying them on a dashboard), several specific functional requirements were identified. These included:
-
Scalable Sensor Network: The architecture had to support a wireless mesh network to allow for easy deployment of sensors without invasive cabling. In addition, the system must allow for the future addition of new sensors without compromising the overall system. In order to fulfill this requirement, we used Zigbee protocol, as it is highly reliable, wireless and consumes little power.
-
Authentication and Access Control: Ensuring secure access to the interface, guaranteeing that only authorized users (within the corporate context) can view the data collected from the cleanroom.
-
Reporting: Generating reports on environmental parameters captured during a selected time frame. This tool is particularly valuable for corporate audits and certification processes.
-
Alerting: As passive monitoring is insufficient for critical anomalies, the system required immediate user notification (via email) upon detection of unexpected environmental values, enabling prompt intervention to rectify the issue.
As the project progressed, and as the team adapted to previously unfamiliar software concepts, the system gained robustness, leading to the implementation of dockerized containers to host the ELK stack. This approach ensured service isolation, environment reproducibility, and a simplified eventual migration to the company’s final infrastructure This way, PICadvanced staff will be able to monitor the cleanroom’s temperature, humidity, particle, and vibration values through a custom interface, which also allows for the downloading of a PDF report containing sensor data for a selected time period.
Results
The data pipeline end-to-end became fully operational: sensors were able to gather data and therefore generate events, which appear in the database (Elasticsearch) as searchable documents. By using Kibana as a plotting tool, we were able to visualize the sensor data as time series. In practice, this translated into the ability to query the “latest value”, compare measurements over time, and rapidly validate whether the system as capturing actual environmental changes (temperature/humidity variations following changes in the physical space or equipment operation).
During the integration phase, the system gathered technical evidence confirming its functional maturity: MQTT messages were continuously consumed, and events were transformed into structured JSON and indexed. When typical production issues arose, the pipeline was tuned until a clean final format was established. This directly resulted in simpler queries and more useful visualizations (coherent numeric fields for graphs and predictable filters by device/source). In parallel, the solution demonstrated scalability: new sensors can be added without structural backend changes, simply by publishing to the broker and adhering to the data contract defined in the pipeline.
Finally, the runtime environment proved to be reproducible: the containerized stack allowed for spinning up services, verifying ingestion, and confirming indexing in a repeatable manner. The forced migration to VMs ultimately reinforced this aspect, as it compelled the consolidation of configurations and resulted in a more controlled deployment process, with clear validations of the critical path (ingestion → parsing → indexing → visualization).
More information - Architecture
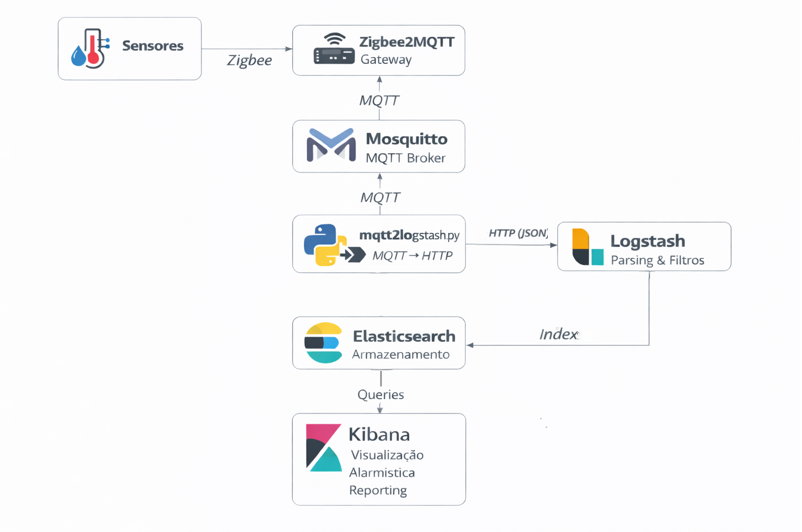
In this section we present a more detailed explanation of the project’s architecture, focusing each of the layers that compose the system:
A. Hardware Layer - Sensor Network:
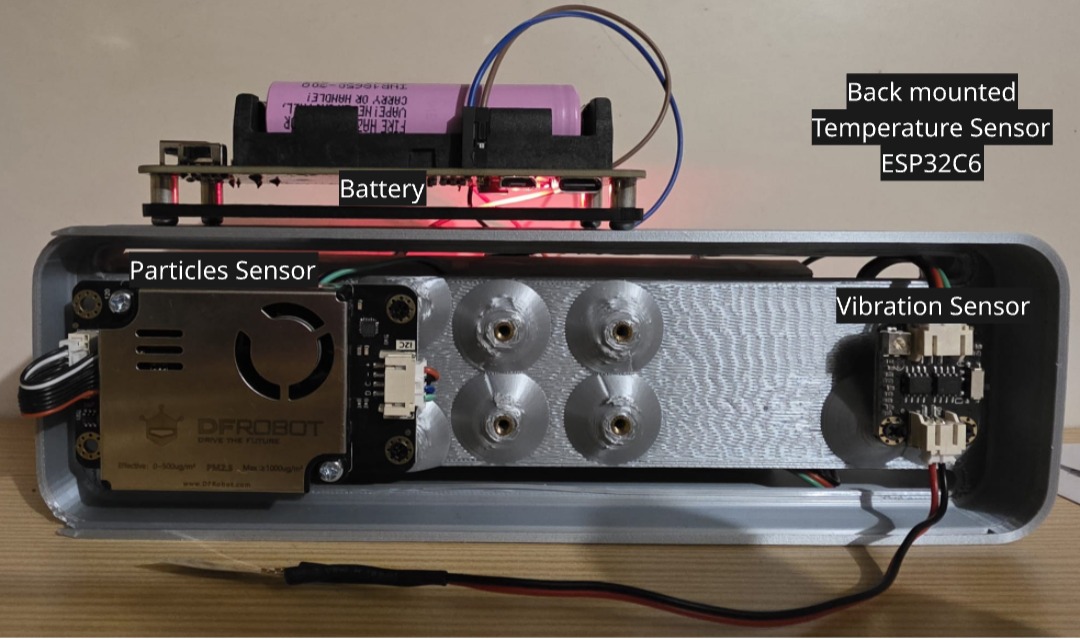
The wireless mesh network operates on the Zigbee protocol. As mentioned above, this choice was driven by Zigbee’s low power consumption and hight reliability. The end devices are specialized sensors that captured several metrics: Temperature, Humidity, Pressure, Air Particles (PM2.5/PM10), and Gas levels. The Gateway is a virtual machine that serves as the central coordinator. It runs Zigbee2MQTT, a bridge that translates Zigbee radio packets into MQTT messages. This decouples the hardware protocol from the software layer, ensuring that any sensor data is immediately available as a standard JSON payload on the network.
B. Core Infrastructure - ELK Stack Data Pipeline:
For data storage and processing, we implemented the industry-standard ELK Stack (Elasticsearch, Logstash, Kibana) running on a centralized server (another Virtual Machine). To ensure reproducibility and ease of deployment, the entire stack was containerized using Docker. Below is a brief explanation of each Docker’s funcionalities in this layer:
-
Logstash (Ingection): Acting as the data parser, Logstash subscribes to the MQTT broker. It filters incoming JSON messages, normalizes data formats, and routes metrics to specific indices based on sensor type.
-
Elasticsearch (Storage): Data is indexed in Elasticsearch, a highly scalable search engine. We implemented Index Lifecycle Management (ILM) strategies to handle data retention efficiently, ensuring fast query responses for real-time dashboards while archiving historical data for audits.
-
Ansible (Automation Tool): To avoid manual setup errors and repetition of the same tasks during development, the server provisioning and Docker deployment were automated using Ansible Playbooks. This ensures that the entire backend infrastructure can be redeployed or recovered in minutes on any standard Linux server.
C. Custom Interface and Alerting:
While Kibana provides powerful raw data visualization, it can be far too complex for daily operations and lacks native alerting features in its free version. To bridge this gap, we developed a custom application layer:
-
Personalized Dashboard: We built a lightweight Web Interface (using Python) that embeds specific Kibana visualizations via iFrames. This interface provides a clean, branded user experience tailored for PICadvanced staff, abstracting the underlying complexity of the Elastic Stack.
-
Python Alerting Engine: To overcome the licensing costs of Elastic’s native alerting features, we engineered a proprietary Python-based monitoring agent. This script runs as a background service (Cron Job), periodically querying the Elasticsearch API to check for values exceeding safety thresholds. Upon detection of an anomaly, it triggers an immediate notification via email, guaranteeing active safety monitoring at zero licensing cost.
-
Reporting